Profiling
To make it easier to track down performance problems GitLab comes with a set of profiling tools, some of these are available by default while others need to be explicitly enabled.
Profiling a URL
There is a Gitlab::Profiler.profile method, and corresponding
bin/profile-url script, that enable profiling a GET or POST request to a
specific URL, either as an anonymous user (the default) or as a specific user.
The first argument to the profiler is either a full URL (including the instance hostname) or an absolute path, including the leading slash.
By default the report dump will be stored in a temporary file, which can be interacted with using the Stackprof API.
When using the script, command-line documentation is available by passing no arguments.
When using the method in an interactive console session, any changes to the application code within that console session is reflected in the profiler output.
For example:
Gitlab::Profiler.profile('/my-user')
# Returns the location of the temp file where the report dump is stored
class UsersController; def show; sleep 100; end; end
Gitlab::Profiler.profile('/my-user')
# Returns the location of the temp file where the report dump is stored
# where 100 seconds is spent in UsersController#show
For routes that require authorization you must provide a user to
Gitlab::Profiler. You can do this like so:
Gitlab::Profiler.profile('/gitlab-org/gitlab-test', user: User.first)Passing a logger: keyword argument to Gitlab::Profiler.profile sends
ActiveRecord and ActionController log output to that logger. Further options are
documented with the method source.
Gitlab::Profiler.profile('/gitlab-org/gitlab-test', user: User.first, logger: Logger.new($stdout))Pass in a profiler_options hash to configure the output file (out) of the sampling data. For example:
Gitlab::Profiler.profile('/gitlab-org/gitlab-test', user: User.first, profiler_options: { out: 'tmp/profile.dump' })
Reading a GitLab::Profiler report
You can get a summary of where time was spent by running Stackprof against the sampling data. For example:
stackprof tmp/profile.dumpExample sampling data:
==================================
  Mode: wall(1000)
  Samples: 8745 (6.92% miss rate)
  GC: 1399 (16.00%)
==================================
     TOTAL    (pct)     SAMPLES    (pct)     FRAME
      1022  (11.7%)        1022  (11.7%)     Sprockets::PathUtils#stat
       957  (10.9%)         957  (10.9%)     (marking)
       493   (5.6%)         493   (5.6%)     Sprockets::PathUtils#entries
       576   (6.6%)         471   (5.4%)     Mustermann::AST::Translator#decorator_for
       439   (5.0%)         439   (5.0%)     (sweeping)
       630   (7.2%)         241   (2.8%)     Sprockets::Cache::FileStore#get
       208   (2.4%)         208   (2.4%)     ActiveSupport::FileUpdateChecker#watched
       206   (2.4%)         206   (2.4%)     Digest::Instance#file
       544   (6.2%)         176   (2.0%)     Sprockets::Cache::FileStore#safe_open
       176   (2.0%)         176   (2.0%)     ActiveSupport::FileUpdateChecker#max_mtime
       268   (3.1%)         147   (1.7%)     ActiveRecord::ConnectionAdapters::PostgreSQLAdapter#exec_no_cache
       140   (1.6%)         140   (1.6%)     ActiveSupport::BacktraceCleaner#add_gem_filter
       116   (1.3%)         116   (1.3%)     Bootsnap::CompileCache::ISeq.storage_to_output
       160   (1.8%)         113   (1.3%)     Gem::Version#<=>
       109   (1.2%)         109   (1.2%)     block in <main>
       108   (1.2%)         108   (1.2%)     Gem::Version.new
       131   (1.5%)         105   (1.2%)     Sprockets::EncodingUtils#unmarshaled_deflated
      1166  (13.3%)          82   (0.9%)     Mustermann::RegexpBased#initialize
        82   (0.9%)          78   (0.9%)     FileUtils.touch
        72   (0.8%)          72   (0.8%)     Sprockets::Manifest.compile_match_filter
        71   (0.8%)          70   (0.8%)     Grape::Router#compile!
        91   (1.0%)          65   (0.7%)     ActiveRecord::ConnectionAdapters::PostgreSQL::DatabaseStatements#query
        93   (1.1%)          64   (0.7%)     ActionDispatch::Journey::Path::Pattern::AnchoredRegexp#accept
        59   (0.7%)          59   (0.7%)     Mustermann::AST::Translator.dispatch_table
        62   (0.7%)          59   (0.7%)     Rails::BacktraceCleaner#initialize
      2492  (28.5%)          49   (0.6%)     Sprockets::PathUtils#stat_directory
       242   (2.8%)          49   (0.6%)     Gitlab::Instrumentation::RedisBase.add_call_details
        47   (0.5%)          47   (0.5%)     URI::RFC2396_Parser#escape
        46   (0.5%)          46   (0.5%)     #<Class:0x00000001090c2e70>#__setobj__
        44   (0.5%)          44   (0.5%)     Sprockets::Base#normalize_logical_path
You can also generate flamegraphs:
stackprof --d3-flamegraph tmp/profile.dump > flamegraph.htmlSee the Stackprof documentation for more details.
Speedscope flamegraphs
You can generate a flamegraph for a particular URL by selecting a flamegraph sampling mode button in the performance bar or by adding the performance_bar=flamegraph parameter to the request.
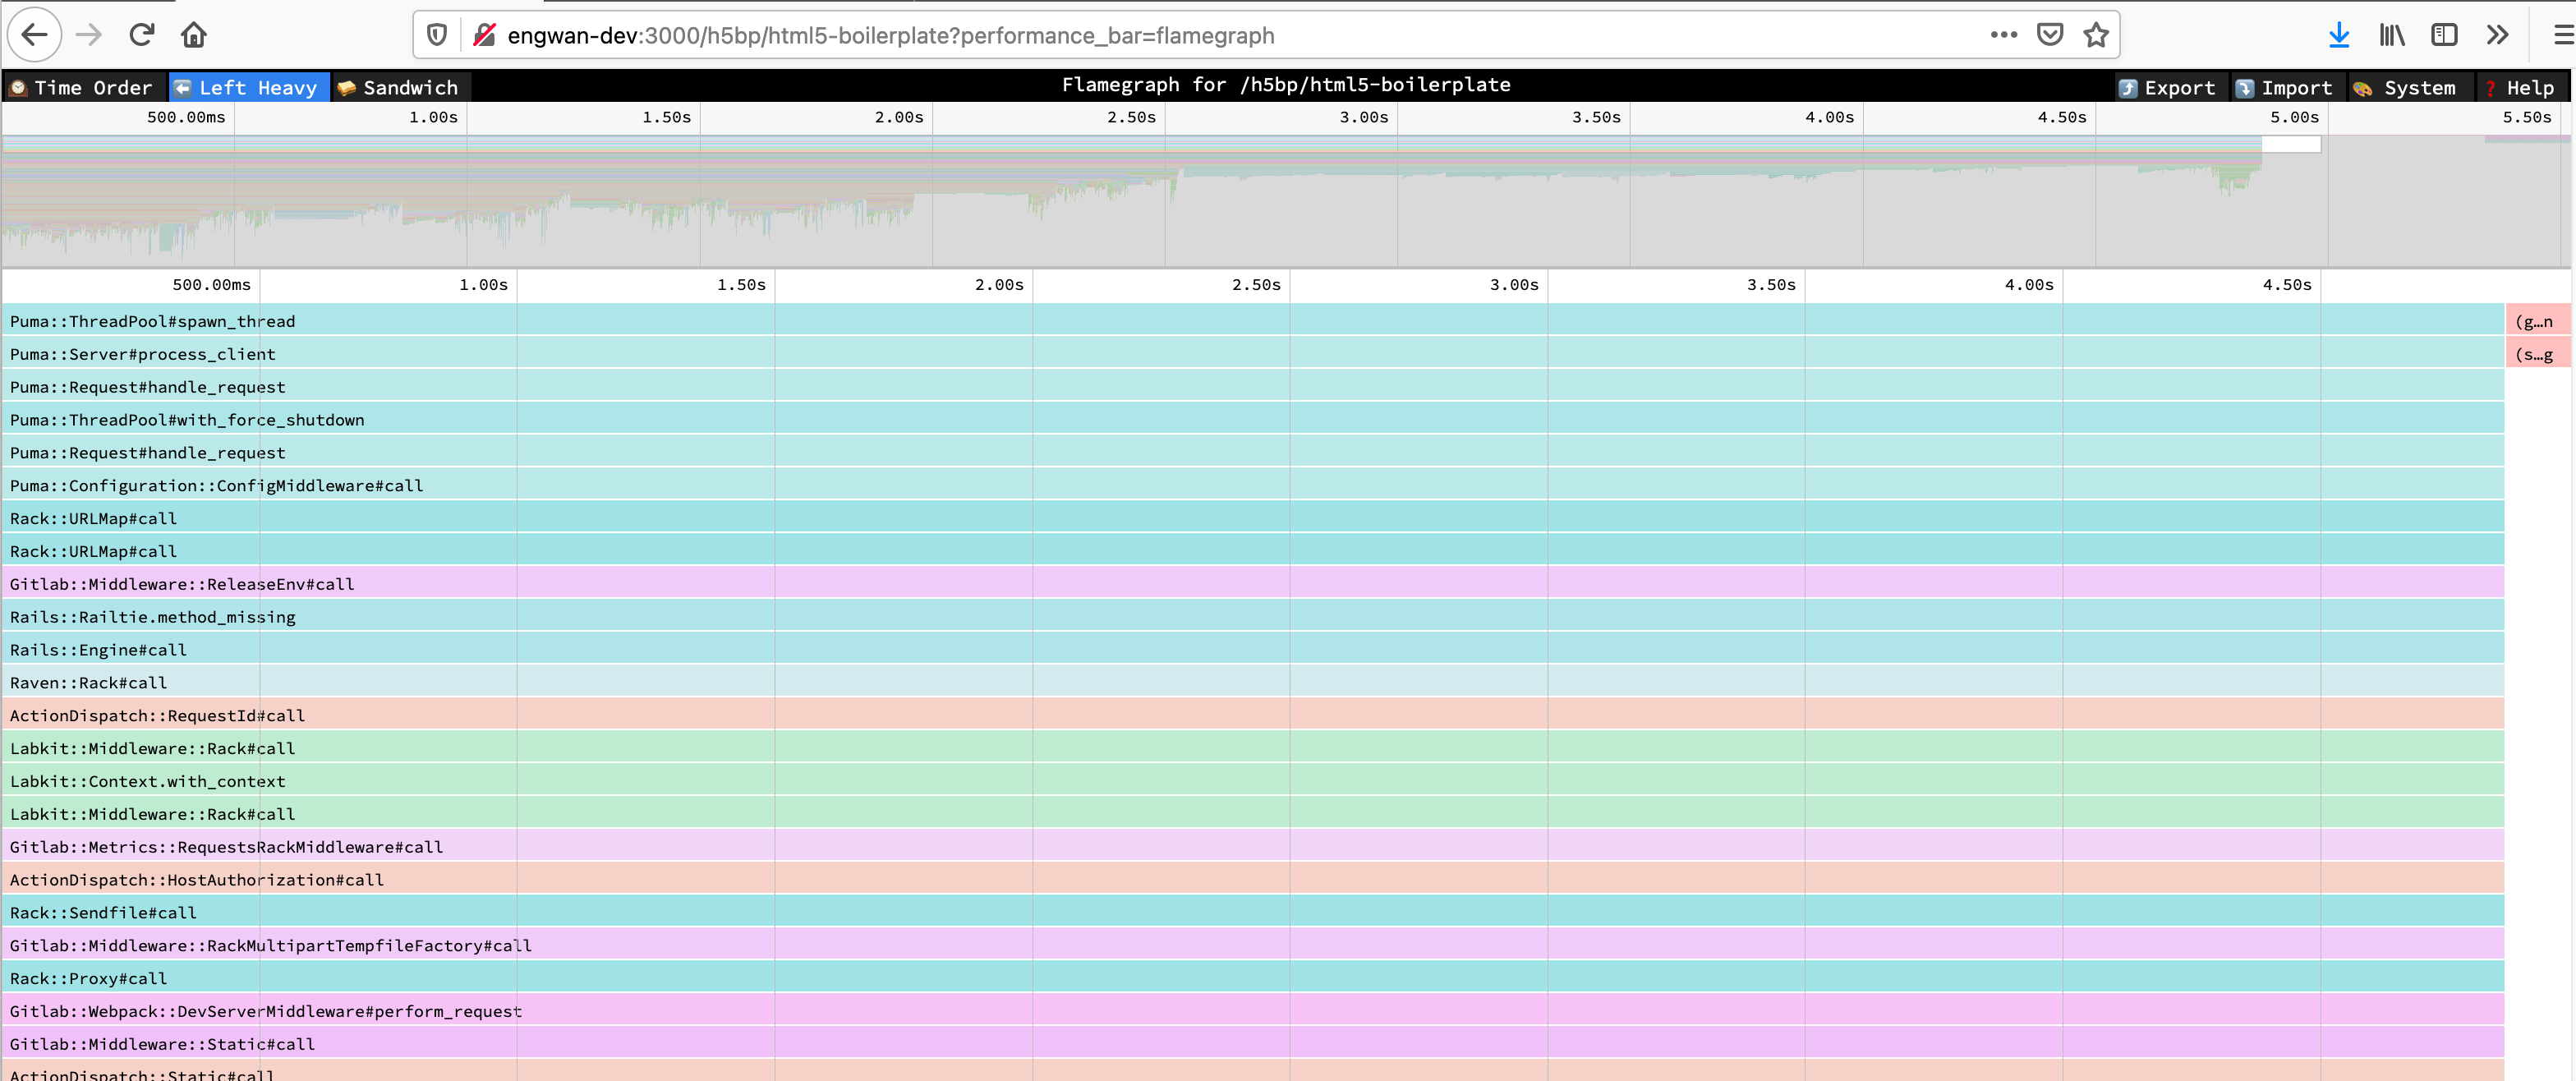
Find more information about the views in the Speedscope docs.
Find more information about different sampling modes in the Stackprof docs.
This is enabled for all users that can access the performance bar.
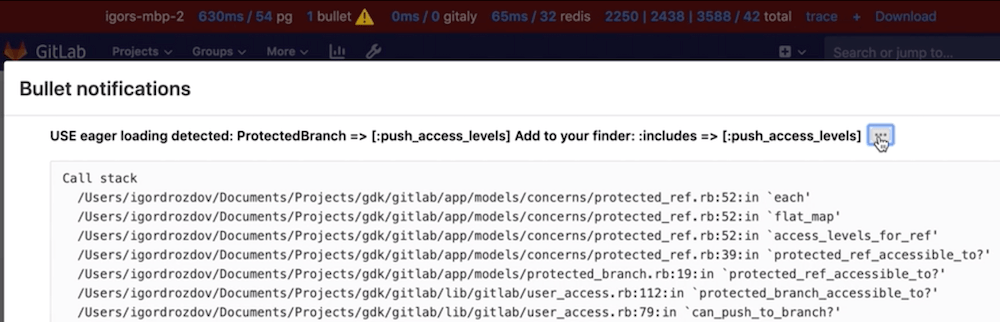
Bullet
Bullet is a Gem that can be used to track down N+1 query problems. It logs query problems to the Rails log and the browser console. The Bullet section is displayed on the performance bar.
Bullet is enabled only in development mode by default. However, logging is disabled, because Bullet logging is noisy. To configure Bullet and its logging:
-
To manually enable or disable Bullet on an environment, add these lines to
config/gitlab.yml, changing theenabledvalue as needed:bullet: enabled: false -
To enable Bullet logging, set the
ENABLE_BULLETenvironment variable to a non-empty value before starting GitLab:ENABLE_BULLET=true bundle exec rails s
As a follow-up to finding N+1 queries with Bullet, consider writing a
QueryRecoder test to prevent a regression.
System stats
During or after profiling, you may want to get detailed information about the Ruby virtual machine process, such as memory consumption, time spent on CPU, or garbage collector statistics. These are easy to produce individually through various tools, but for convenience, a summary endpoint has been added that exports this data as a JSON payload:
curl localhost:3000/-/metrics/system | jqExample output:
{
  "version": "ruby 2.7.2p137 (2020-10-01 revision a8323b79eb) [x86_64-linux-gnu]",
  "gc_stat": {
    "count": 118,
    "heap_allocated_pages": 11503,
    "heap_sorted_length": 11503,
    "heap_allocatable_pages": 0,
    "heap_available_slots": 4688580,
    "heap_live_slots": 3451712,
    "heap_free_slots": 1236868,
    "heap_final_slots": 0,
    "heap_marked_slots": 3451450,
    "heap_eden_pages": 11503,
    "heap_tomb_pages": 0,
    "total_allocated_pages": 11503,
    "total_freed_pages": 0,
    "total_allocated_objects": 32679478,
    "total_freed_objects": 29227766,
    "malloc_increase_bytes": 84760,
    "malloc_increase_bytes_limit": 32883343,
    "minor_gc_count": 88,
    "major_gc_count": 30,
    "compact_count": 0,
    "remembered_wb_unprotected_objects": 114228,
    "remembered_wb_unprotected_objects_limit": 228456,
    "old_objects": 3185330,
    "old_objects_limit": 6370660,
    "oldmalloc_increase_bytes": 21838024,
    "oldmalloc_increase_bytes_limit": 119181499
  },
  "memory_rss": 1326501888,
  "memory_uss": 1048563712,
  "memory_pss": 1139554304,
  "time_cputime": 82.885264633,
  "time_realtime": 1610459445.5579069,
  "time_monotonic": 24001.23145713,
  "worker_id": "puma_0"
}
NOTE: This endpoint is only available for Rails web workers. Sidekiq workers cannot be inspected this way.
Settings that impact performance
Application settings
-
developmentenvironment by default works with hot-reloading enabled, this makes Rails to check file changes every request, and create a potential contention lock, as hot reload is single threaded. -
developmentenvironment can load code lazily once the request is fired which results in first request to always be slow.
To disable those features for profiling/benchmarking set the RAILS_PROFILE environment variable to true before starting GitLab. For example when using GDK:
- create a file
env.runitin the root GDK directory - add
export RAILS_PROFILE=trueto yourenv.runitfile - restart GDK with
gdk restart
This environment variable is only applicable for the development mode.
GC settings
Ruby's garbage collector (GC) can be tuned via a variety of environment variables that will directly impact application performance.
The following table lists these variables along with their default values.
| Environment variable | Default value |
|---|---|
RUBY_GC_HEAP_INIT_SLOTS |
10000 |
RUBY_GC_HEAP_FREE_SLOTS |
4096 |
RUBY_GC_HEAP_FREE_SLOTS_MIN_RATIO |
0.20 |
RUBY_GC_HEAP_FREE_SLOTS_GOAL_RATIO |
0.40 |
RUBY_GC_HEAP_FREE_SLOTS_MAX_RATIO |
0.65 |
RUBY_GC_HEAP_GROWTH_FACTOR |
1.8 |
RUBY_GC_HEAP_GROWTH_MAX_SLOTS |
0 (disable) |
RUBY_GC_HEAP_OLDOBJECT_LIMIT_FACTOR |
2.0 |
RUBY_GC_MALLOC_LIMIT(_MIN) |
(16 * 1024 * 1024 /* 16MB */) |
RUBY_GC_MALLOC_LIMIT_MAX |
(32 * 1024 * 1024 /* 32MB */) |
RUBY_GC_MALLOC_LIMIT_GROWTH_FACTOR |
1.4 |
RUBY_GC_OLDMALLOC_LIMIT(_MIN) |
(16 * 1024 * 1024 /* 16MB */) |
RUBY_GC_OLDMALLOC_LIMIT_MAX |
(128 * 1024 * 1024 /* 128MB */) |
RUBY_GC_OLDMALLOC_LIMIT_GROWTH_FACTOR |
1.2 |
(Source)
GitLab may decide to change these settings to speed up application performance, lower memory requirements, or both.
You can see how each of these settings affect GC performance, memory use and application start-up time for an idle instance of
GitLab by running the scripts/perf/gc/collect_gc_stats.rb script. It will output GC stats and general timing data to standard
out as CSV.